Key findings
38
The median mobile PageSpeed score across 537 Shopify stores. Only one store scores 90 or more; 75% score under 50.
59%
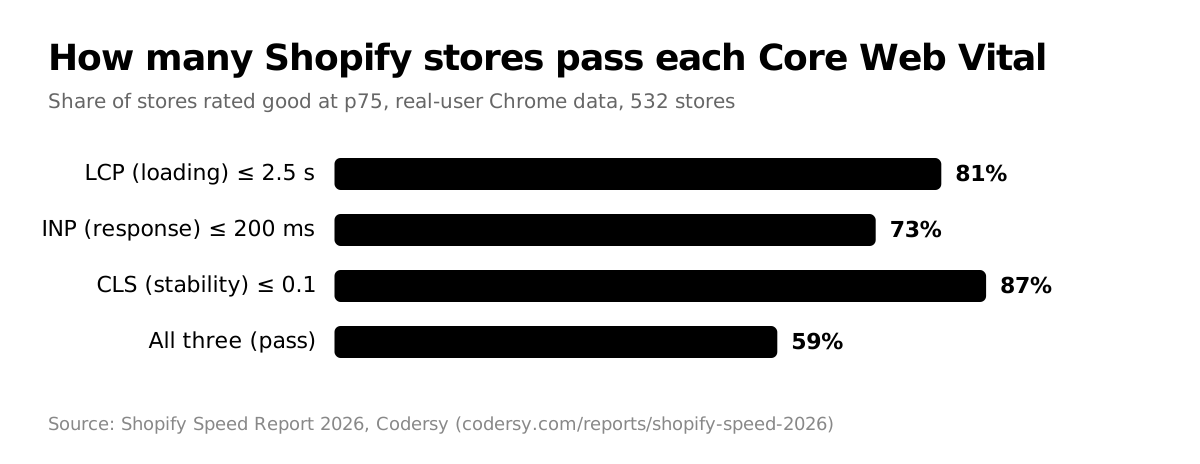
of stores pass Core Web Vitals for their real mobile visitors (Chrome data, 532 stores). A low lab score is not the same as a slow store.
73%
have a good INP, the metric for how fast the page responds to a tap. It fails more often than loading (LCP, 81% good) or layout shift (CLS, 87% good).
23
third-party providers load on the median store's homepage: apps, tags, chat, reviews, fonts. Together they are 32% of the page's weight.
54 vs 32
The median score of stores with under 10 third-party providers against stores with 30 or more.
7.2 MB
The median mobile homepage weight, with 2.3 MB of JavaScript and 406 requests.
Lab scores are low; real visitors see faster stores
The median mobile PageSpeed score was 38, and half the stores scored between 31 and 49. Only one store reached 90. The lab test loads the page on an emulated mid-range phone over a slow 4G connection, which is harder than most real visits: the median lab LCP was 10.8 s, while the median LCP that real mobile visitors saw was 1.87 s.
Google ranks pages on the field data, and 59% of the 532 stores with enough traffic pass all three Core Web Vitals for their mobile visitors. Even among stores that scored under 50 in the lab, 55% pass.
Where stores fail is responsiveness. 73% have a good Interaction to Next Paint (200 ms or less), against 81% with a good LCP and 87% with a good CLS. INP measures how long the page takes to react to a tap, and on a Shopify store it is mostly spent running JavaScript from apps and tags.
Speed by category
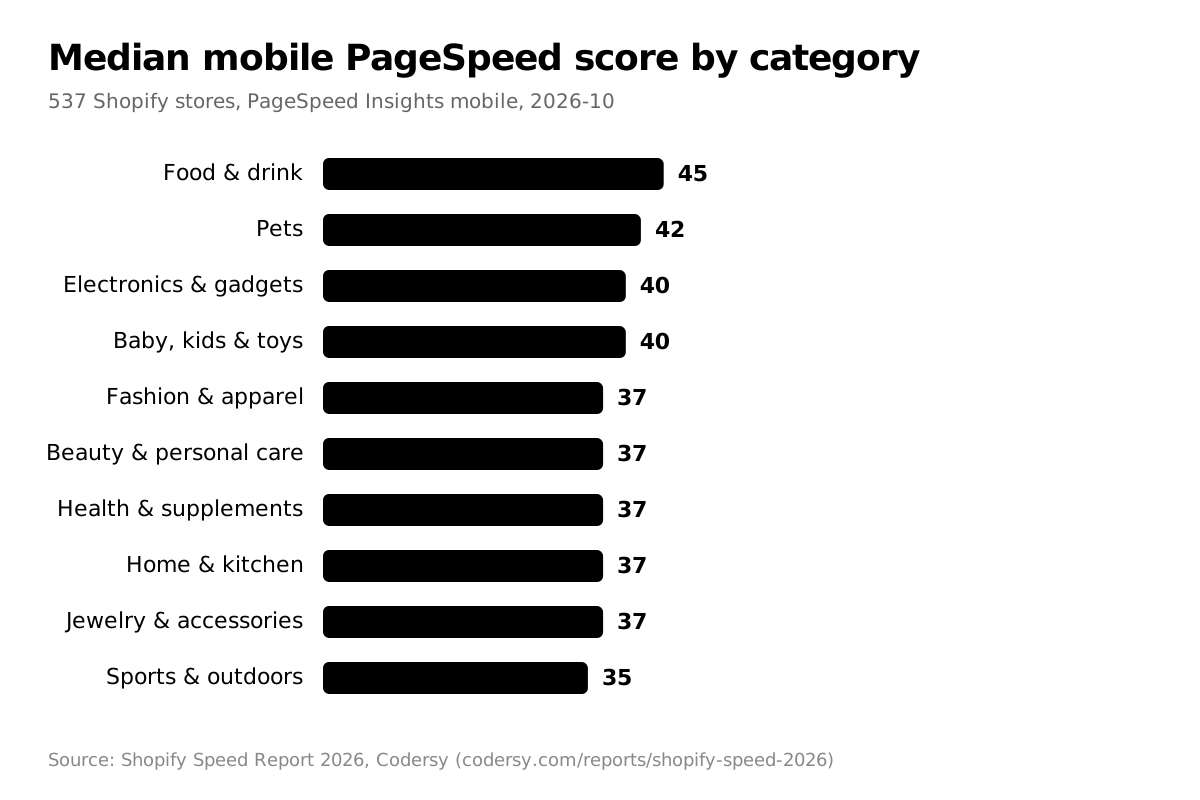
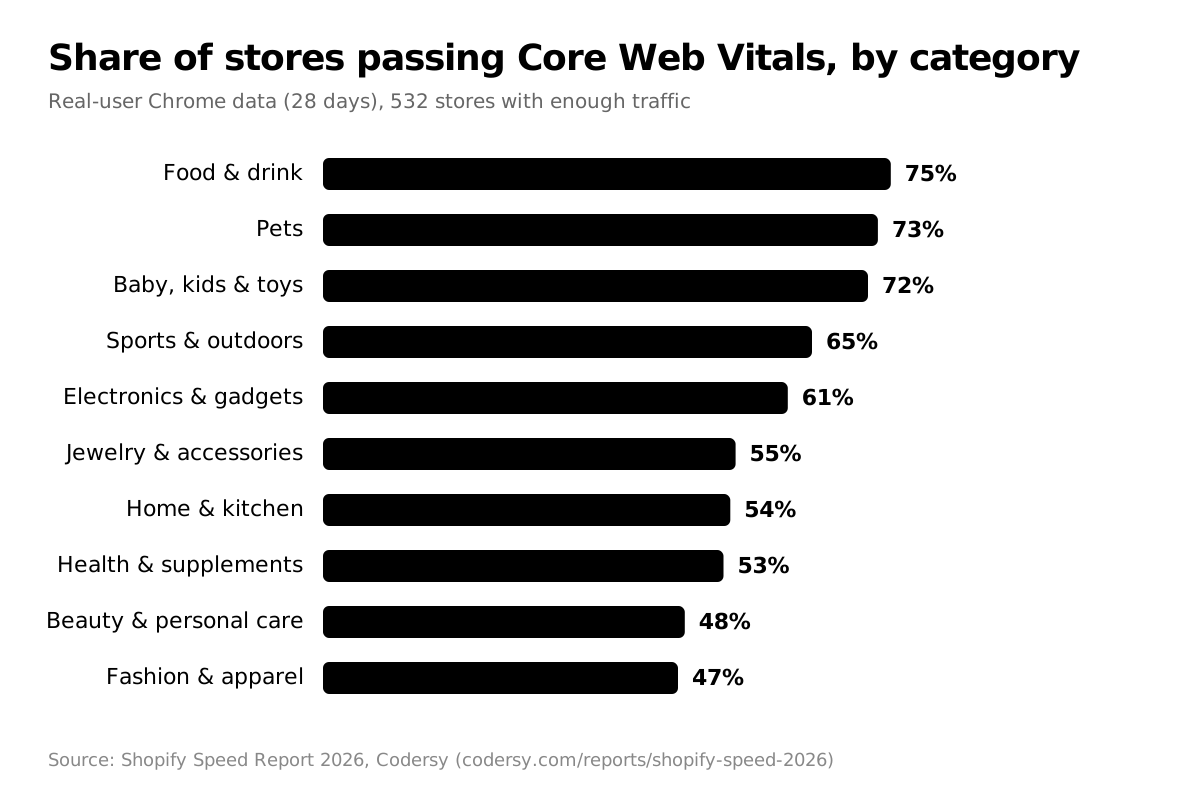
Food & drink stores had the highest median score (45) and sports & outdoors the lowest (35). The gaps between categories are smaller than the gaps inside each one: in every category the fastest tenth of stores score 54 or more and the slowest tenth 30 or less, so what a store sells doesn't decide how fast it is.
| Group | Stores | Median mobile score | Pass Core Web Vitals | Median page weight | Median third-party weight |
|---|---|---|---|---|---|
| Food & drink | 58 | 45 | 75% | 5.9 MB | 2.2 MB |
| Pets | 47 | 42 | 73% | 6 MB | 1.7 MB |
| Electronics & gadgets | 44 | 40 | 61% | 6.1 MB | 2.2 MB |
| Baby, kids & toys | 50 | 40 | 72% | 6.8 MB | 1.9 MB |
| Fashion & apparel | 64 | 37 | 47% | 7.8 MB | 2.5 MB |
| Beauty & personal care | 68 | 37 | 48% | 6.8 MB | 2.4 MB |
| Health & supplements | 51 | 37 | 53% | 7.2 MB | 3.0 MB |
| Home & kitchen | 52 | 37 | 54% | 7.6 MB | 2.7 MB |
| Jewelry & accessories | 55 | 37 | 55% | 7.1 MB | 2.3 MB |
| Sports & outdoors | 48 | 35 | 65% | 9.2 MB | 2.6 MB |
Apps and tags: the biggest cost you control
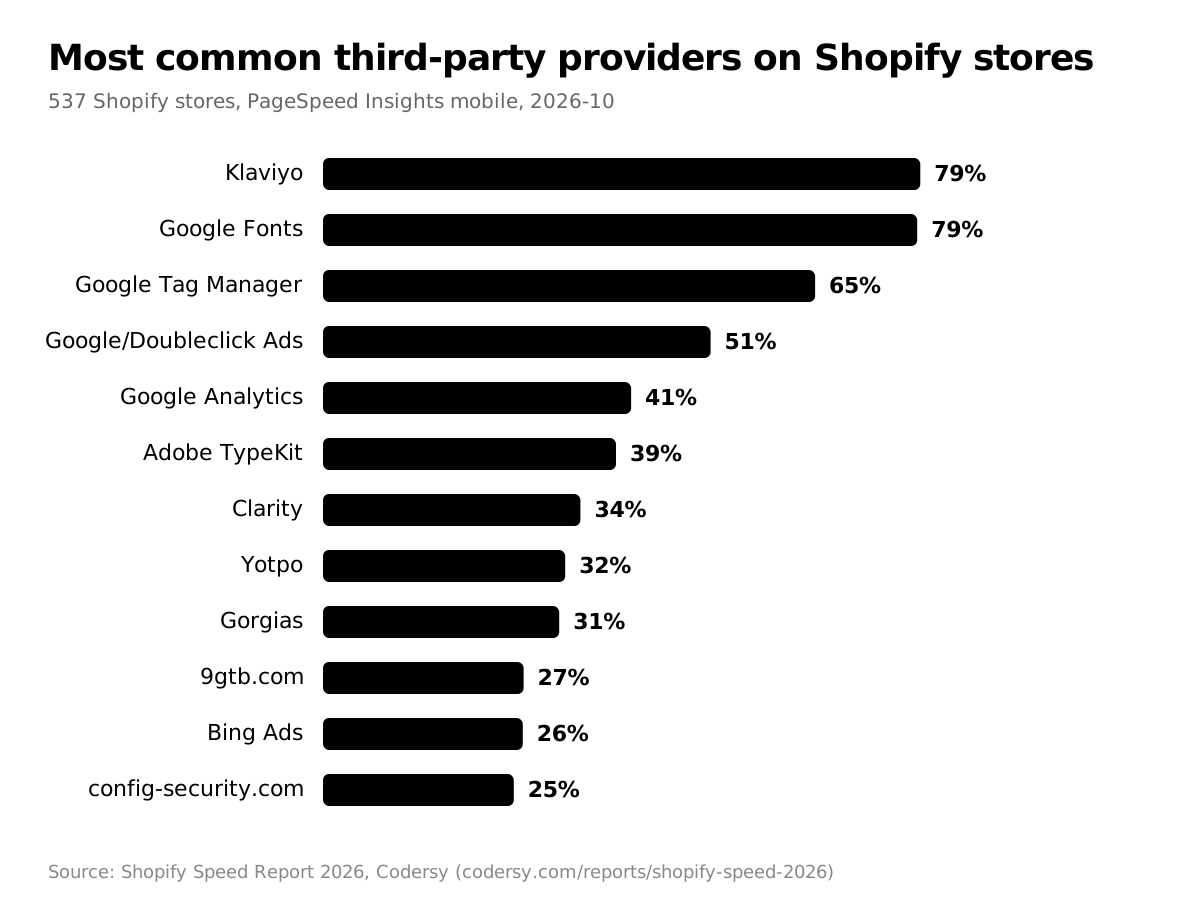
The median homepage loads 23 third-party providers. They add up to 32% of the page's weight and 1.6 seconds of main-thread work on a phone, the work that delays a page's response to taps. The most common are Klaviyo (79% of stores), Google Fonts (79% of stores), Google Tag Manager (65% of stores).
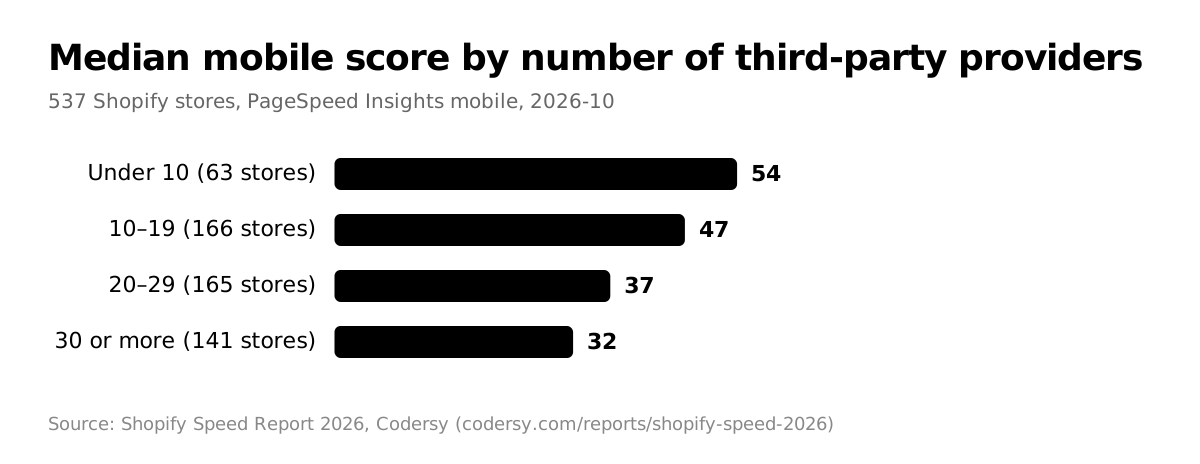
The more providers a store loads, the lower it scores: a median of 54 with fewer than 10, and 32 with 30 or more. Google Tag Manager, on 65% of stores, costs a median 536 ms of main-thread time on its own, because every tag inside it runs on the phone.
| Provider | Share of stores | Median transfer size | Median main-thread time |
|---|---|---|---|
| Klaviyo | 79% | 329 KB | 164 ms |
| Google Fonts | 79% | 26 KB | 0 ms |
| Google Tag Manager | 65% | 544 KB | 536 ms |
| Google/Doubleclick Ads | 51% | 5 KB | 2 ms |
| Google Analytics | 41% | 1 KB | 0 ms |
| Adobe TypeKit | 39% | 32 KB | 0 ms |
| Clarity | 34% | 29 KB | 160 ms |
| Yotpo | 32% | 203 KB | 126 ms |
| Gorgias | 31% | 2 KB | 0 ms |
| 9gtb.com | 27% | 64 KB | 37 ms |
| Bing Ads | 26% | 19 KB | 15 ms |
| config-security.com | 25% | 64 KB | 1 ms |
| 25% | 232 KB | 232 ms | |
| Attentive | 23% | 65 KB | 30 ms |
| Okendo | 23% | 12 KB | 8 ms |
| Rebuy | 23% | 577 KB | 241 ms |
| TikTok | 19% | 161 KB | 165 ms |
| Alia | 16% | 290 KB | 345 ms |
| Recharge | 16% | 131 KB | 92 ms |
| OneTrust | 16% | 227 KB | 137 ms |
Themes, Hydrogen and other headless storefronts
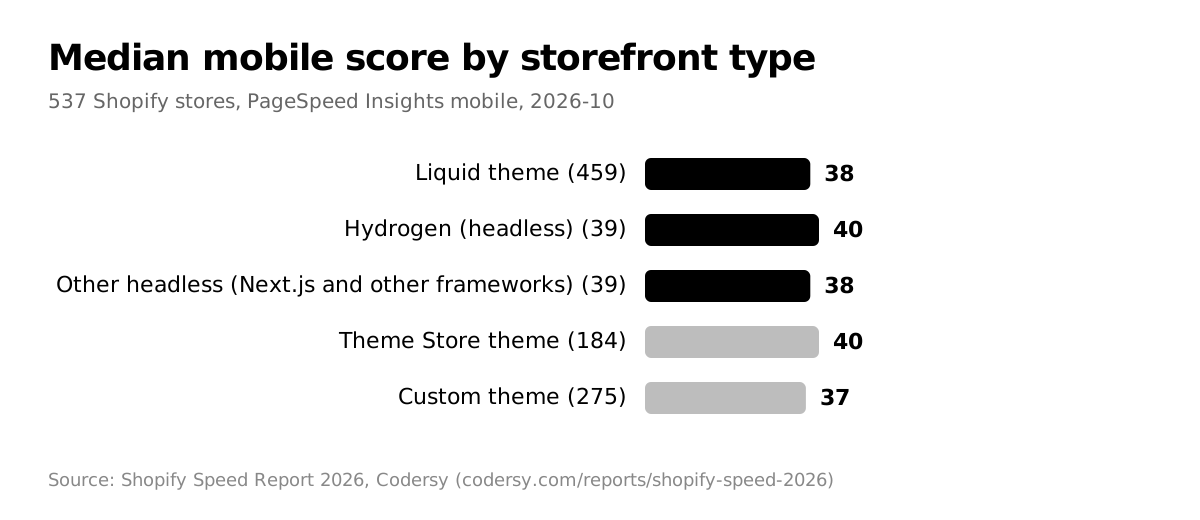
The 39 Hydrogen stores in the sample have a median score of 40, above the 38 of the 459 stores on Liquid themes, and 36% of them pass Core Web Vitals with real users, below 63% for Liquid. Other headless storefronts (39 stores on Next.js and other frameworks) have a median score of 38 and a 46% pass rate.
By metric, 67% of Hydrogen stores have a good CLS (layout stability) against 90% on Liquid; 64% of Hydrogen stores have a good LCP (loading) against 84% on Liquid; 56% of Hydrogen stores have a good INP (response to taps) against 75% on Liquid.
A headless storefront moves work the theme used to do into the build: rendering the first screen on the server, sizing images, reserving space for content that loads later. When that work is skipped, real visitors see it as late content and a page that jumps, even when the lab score is fine. The headless groups are small, so read them as a direction rather than a verdict: going headless doesn't make a store fast by itself.
Among Liquid stores, the 184 that run a Theme Store theme (Dawn, Prestige, Impulse and others, often modified) have a median score of 40 and a 69% pass rate; the 275 on custom themes have 37 and 58%.
| Group | Stores | Median mobile score | Pass Core Web Vitals | Median page weight | Median third-party weight |
|---|---|---|---|---|---|
| Liquid theme | 459 | 38 | 63% | 7.3 MB | 2.4 MB |
| Hydrogen (headless) | 39 | 40 | 36% | 4.2 MB | 2.1 MB |
| Other headless (Next.js and other frameworks) | 39 | 38 | 46% | 6.4 MB | 2.1 MB |
| Theme Store theme | 184 | 40 | 69% | 6.9 MB | 2.2 MB |
| Custom theme | 275 | 37 | 58% | 7.5 MB | 2.5 MB |
What this means for your store
- Check the field data first. If your store passes Core Web Vitals for real visitors, a lab score in the 30s is normal for Shopify and not an emergency.
- Fix INP before chasing the score. It is the metric most stores fail, and it comes from JavaScript: apps, tag managers, chat widgets and review carousels.
- Count your third parties. Remove apps you no longer use (their scripts often stay behind), go through what runs inside your tag manager, and load reviews and chat only on the pages that need them.
- Measure before and after. Run the Shopify speed test before a change and again after it, and watch the field data over the next 28 days.
Method
- Sample. 743 well-known direct-to-consumer brands in 10 categories, picked from brands publicly known to sell on Shopify. Each homepage was opened in a browser and kept only if Shopify serves it (a Liquid theme, Hydrogen on Oxygen, or a custom frontend on Shopify's Storefront API). 537 stores were tested. Codersy's own clients were left out.
- Lab test. One run per store of Google PageSpeed Insights, mobile strategy, performance category, on October 25, 2026 (Lighthouse 13.5.0). Lighthouse emulates a mid-range phone on a throttled 4G connection.
- Field data. The Chrome UX Report data PageSpeed Insights returns for each store's origin, phone visitors, 28 days. A store passes Core Web Vitals when its 75th-percentile LCP is 2.5 s or less, INP 200 ms or less and CLS 0.1 or less. Stores without INP data are left out of the pass rates.
- Third parties. Lighthouse's own entity list. Shopify's scripts and its image CDN count as the platform, not a third party; generic CDNs are left out of the provider chart but count in the totals.
- Limits. The sample leans towards larger, mostly US brands, which run more apps and tags than a typical small store, so the medians describe established brands rather than every Shopify store. One lab run per store varies by a few points; the medians across hundreds of stores hold steady. Only the homepage was tested.
Use the data
The charts and the data are free to use under CC BY 4.0: credit “Shopify Speed Report 2026, Codersy” with a link to this page. The CSV has one row per store with every metric above. The charts are SVG files you can link to or download:
- How many Shopify stores pass each Core Web Vital
- Median mobile PageSpeed score by category
- Share of stores passing Core Web Vitals, by category
- Most common third-party providers on Shopify stores
- Median mobile score by number of third-party providers
- Median mobile score by storefront type
To embed one, use this code with the chart's file name:
<a href="https://www.codersy.com/reports/shopify-speed-2026">
  <img src="https://www.codersy.com/assets/reports/shopify-speed-2026/score-by-category.svg" alt="Median mobile PageSpeed score by category, Shopify Speed Report 2026 by Codersy" width="1200">
</a>