Shopify is no longer a platform for small stores. It processes more than a hundred billion dollars of sales a quarter, most of its revenue now comes from payments rather than subscriptions, and its average store is faster than the stores of the best-known brands on it.
Every number on this page comes from the organisation that produced it: Shopify's own SEC filings and investor releases, HTTP Archive and the Chrome UX Report, Baymard Institute, Adobe, the US Census Bureau, Eurostat, and our own Shopify Speed Report. Each one links to the original document and carries the date of the data. Where a figure is a company's own claim, the text says so. We update the page every month.
Key Takeaways
- Shopify facilitated $119.1 billion of GMV in Q3 2026, up 29% year on year (Shopify, Form 10-Q for Q3 2026, November 2026).
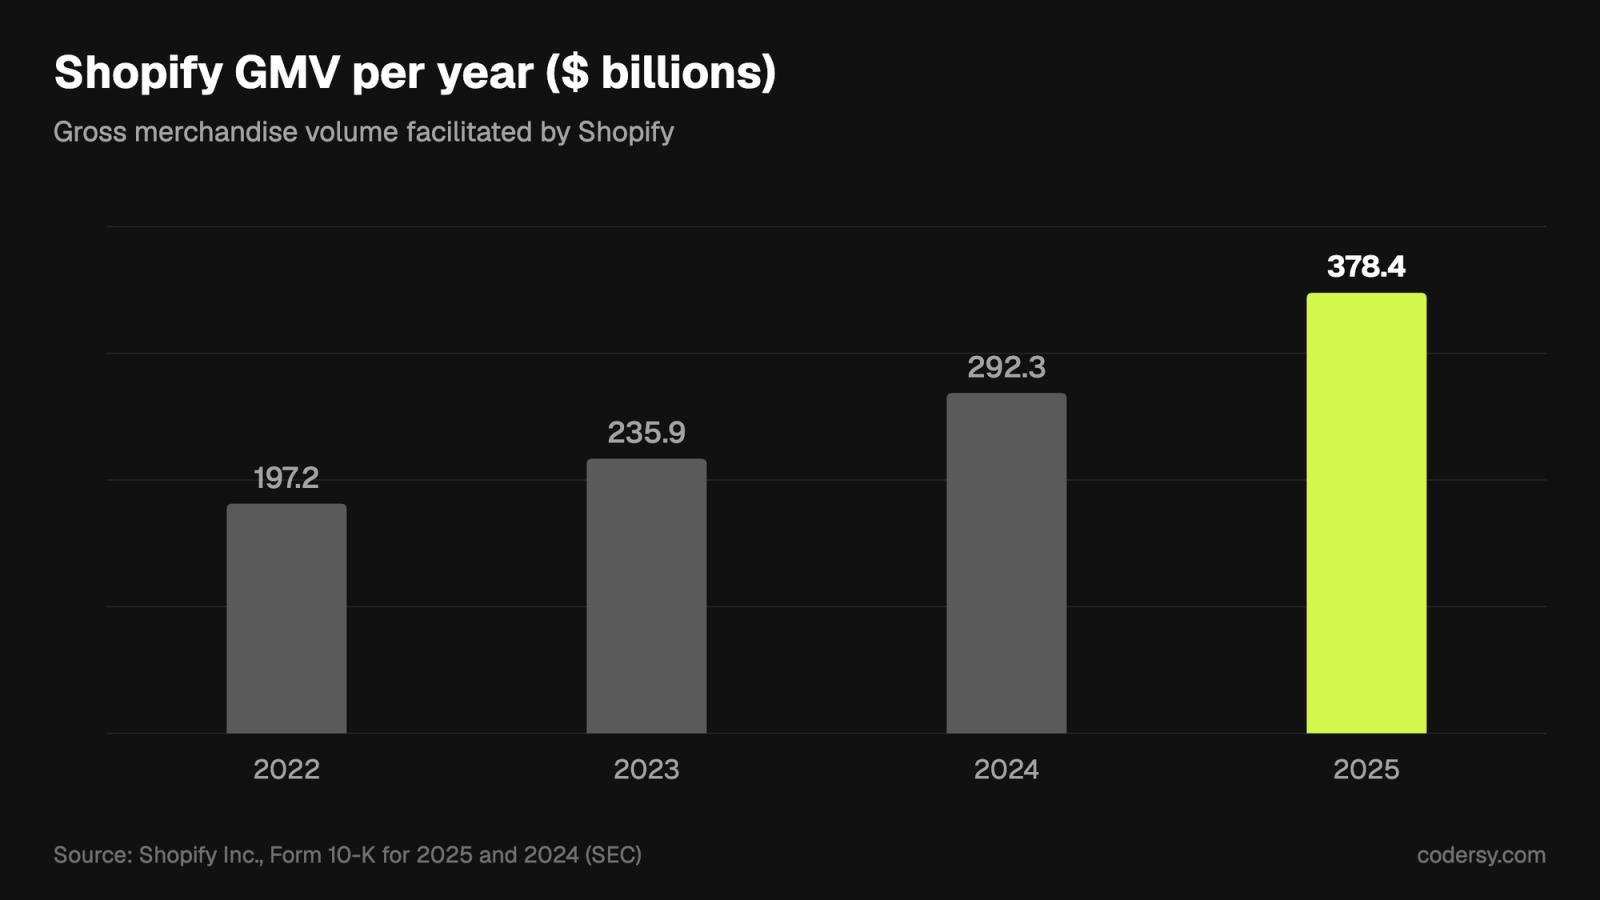
- In 2025 Shopify's GMV was $378.4 billion and its revenue $11.6 billion, up 30% (Shopify, Form 10-K for 2025, February 2026).
- 68% of Shopify GMV now runs through Shopify Payments (Shopify, Form 10-Q for Q3 2026, November 2026).
- Shopify powers about a quarter of mobile ecommerce sites, 25.3% (HTTP Archive, Web Almanac 2025: Ecommerce, January 2026).
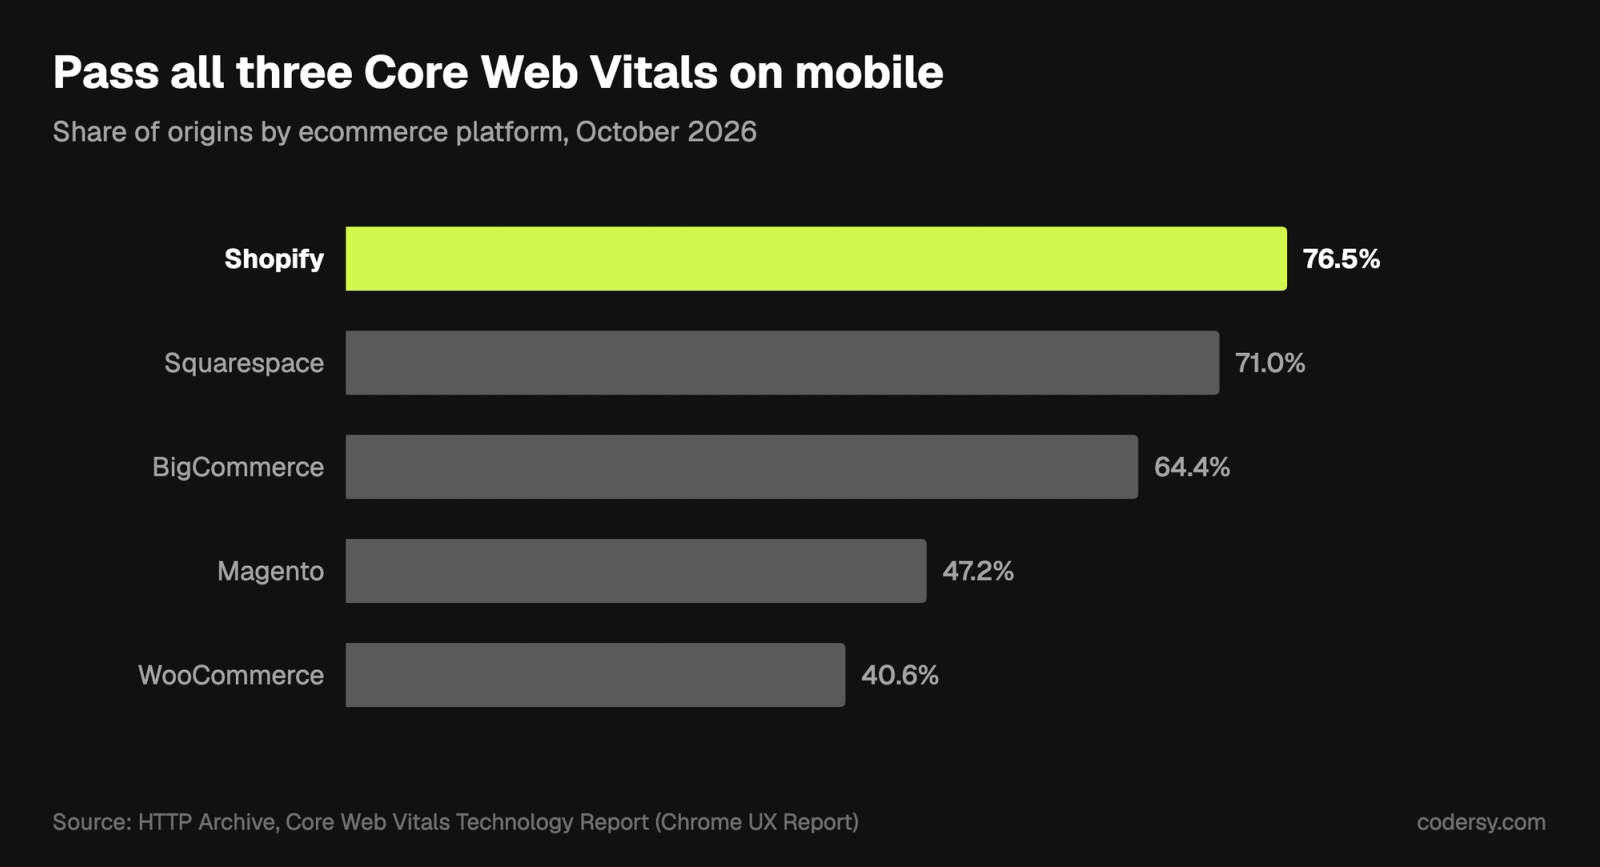
- 76.5% of Shopify stores pass Core Web Vitals on mobile, against 40.6% of WooCommerce stores (HTTP Archive, Core Web Vitals Technology Report, October 2026).
- Only 59.4% of well-known Shopify brands pass Core Web Vitals, well below the Shopify average (Codersy, Shopify Speed Report 2026, October 2026).
- The median well-known Shopify store loads 23 third-party providers on its homepage (Codersy, Shopify Speed Report 2026, October 2026).
- The Shopify App Store has more than 21,000 apps (Shopify, Form 10-K for 2025, February 2026).
- 70.22% of online shopping carts are abandoned (Baymard Institute, Cart Abandonment Rate, October 2026).
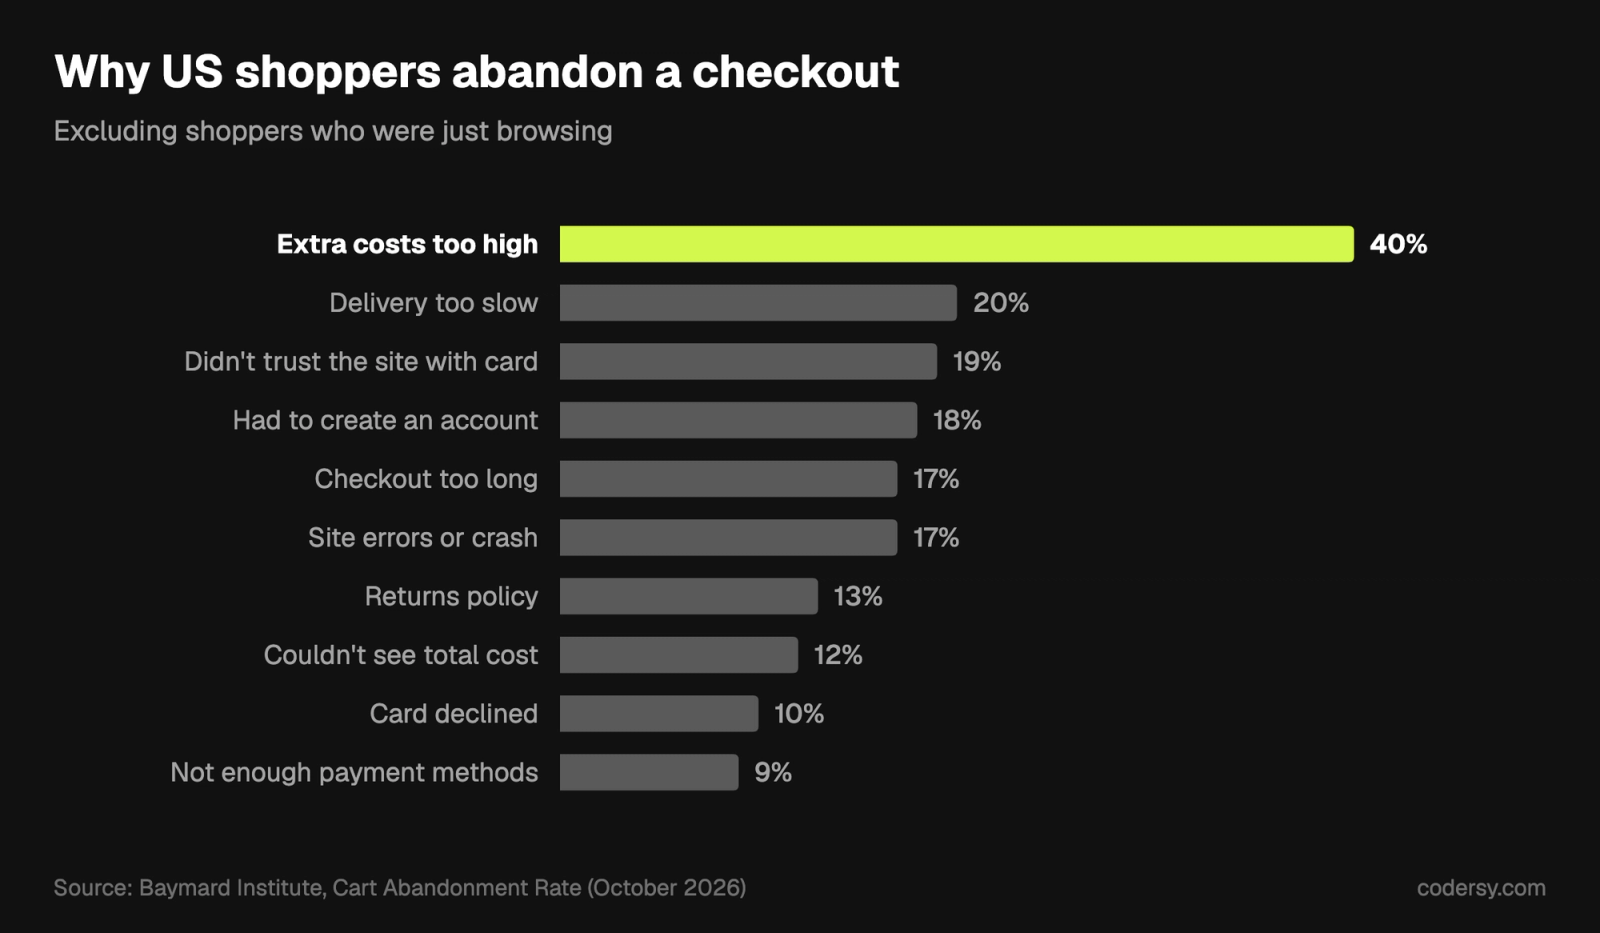
- 40% of shoppers who abandon a checkout do it because of extra costs such as shipping, tax and fees (Baymard Institute, Cart Abandonment Rate, October 2026).
- AI-referred orders on Shopify grew nearly 13 times year on year in Q1 2026 (Shopify, AI search insights, May 2026).
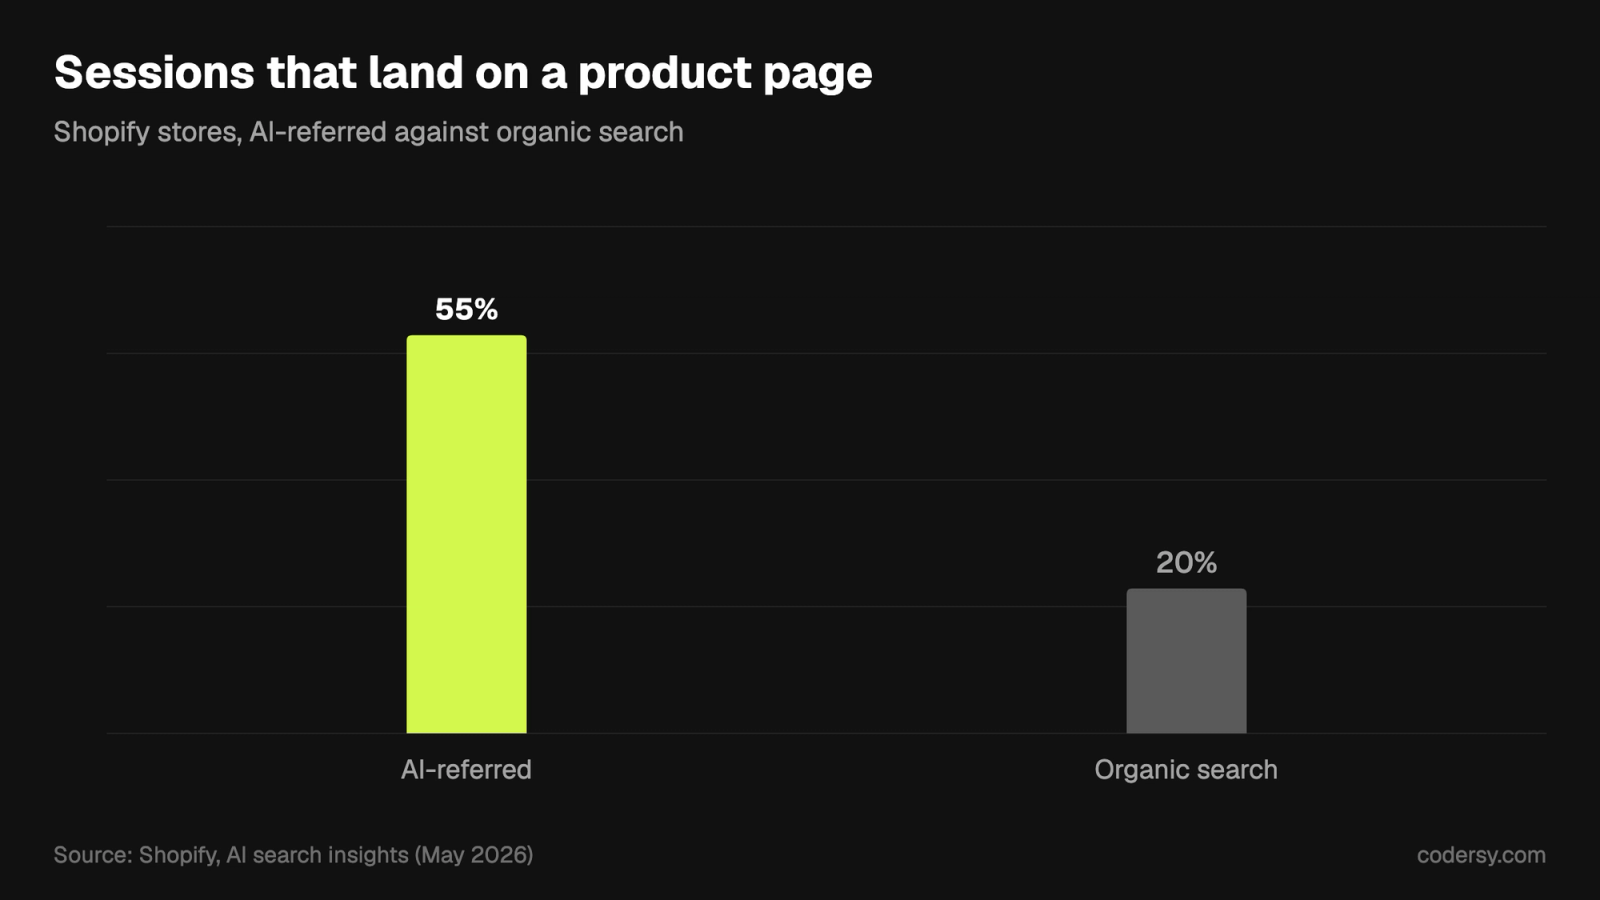
- AI-referred sessions convert 49% better than organic search (Shopify, AI search insights, May 2026).
- Ecommerce is 17.1% of all US retail sales (US Census Bureau, Quarterly E-Commerce Report, August 2026).
How big is Shopify?
Shopify grows faster than ecommerce itself, and the money now comes from payments. Subscriptions are the smaller and slower half of the business.
How much do merchants sell through Shopify?
More every year. GMV was $197.2 billion in 2022 (Shopify, Form 10-K for 2024, February 2025), $235.9 billion in 2023 and $292.3 billion in 2024 (Shopify, Form 10-K for 2025, February 2026). In the first nine months of 2026 merchants sold $335.5 billion through Shopify, 32% more than a year earlier (Shopify, Form 10-Q for Q3 2026, November 2026). In constant currency, Q3 GMV growth was 30% (Shopify, Form 10-Q for Q3 2026, November 2026). Shopify calculates that its platform has facilitated $1.6 trillion of GMV in total and holds more than 14% of US ecommerce; this is the company's own calculation (Shopify, Investor Relations, November 2026).
How much does Shopify earn?
Revenue grows a little faster than GMV. Q3 2026 revenue was $3,742 million, up 32% (Shopify, Q3 2026 results, November 2026). Merchant solutions brought in $2,906 million, up 35%, and subscription solutions $836 million, up 20% (Shopify, Q3 2026 results, November 2026). Merchant solutions were 77% of revenue in the first nine months of 2026 (Shopify, Form 10-Q for Q3 2026, November 2026). Monthly recurring revenue reached $230 million, up 19% (Shopify, Form 10-Q for Q3 2026, November 2026), from $205 million at the end of 2025 (Shopify, Form 10-K for 2025, February 2026). At the end of 2022 MRR was $109 million (Shopify, Form 10-K for 2024, February 2025). Operating income was $568 million, up 66%, and free cash flow $816 million, a 22% margin (Shopify, Q3 2026 results, November 2026). For the full year 2025 the free cash flow margin was 17% (Shopify, Q4 2025 results, February 2026). Revenue growth in 2025 was 4 percentage points higher than in 2024 (Shopify, Q4 2025 results, February 2026). For Q4 2026 Shopify expects revenue to grow at a low-thirties percentage rate (Shopify, Q3 2026 results, November 2026).
How many merchants use Shopify Payments?
Most of them, and the share keeps rising. Shopify Payments processed $81.4 billion of GMV in Q3 2026, 35% more than a year earlier (Shopify, Form 10-Q for Q3 2026, November 2026). In the first nine months of 2026 the total was $226.5 billion (Shopify, Form 10-Q for Q3 2026, November 2026). For the full year 2025 penetration was 65.6%, or $248.1 billion, up from 61.9% in 2024 (Shopify, Form 10-K for 2025, February 2026). Adoption is 88% in North America, 89% in Asia Pacific and 83% in Europe, the Middle East and Africa (Shopify, Form 10-K for 2025, February 2026). Shopify also bought $1.5 billion of merchant loans and cash advances in Q3 (Shopify, Form 10-Q for Q3 2026, November 2026).
Where are Shopify merchants?
Mostly in the US, but not only there. Merchants come from more than 175 countries (Shopify, Q3 2026 results, November 2026). 44% are in the United States, 31% in Europe, the Middle East and Africa, and 16% in Asia Pacific (Shopify, Form 10-K for 2025, February 2026). In Q3 2026, 63% of revenue came from the United States, 20% from Europe and 10% from Asia Pacific (Shopify, Form 10-Q for Q3 2026, November 2026). Shopify had about 7,600 employees at the end of 2025 (Shopify, Form 10-K for 2025, February 2026).
How fast are Shopify stores?
The average Shopify store is fast. The famous ones are not, and the gap comes from what brands add on top of Shopify.
How many Shopify stores pass Core Web Vitals?
Three in four. In October 2026, 71.0% of Squarespace, 64.4% of BigCommerce and 47.2% of Magento origins passed on mobile (HTTP Archive, Core Web Vitals Technology Report, October 2026). Shopify's mobile pass rate rose from 72.9% in October 2024 (HTTP Archive, Core Web Vitals Technology Report, October 2026), while the number of Shopify origins in the Chrome data grew from 359,591 to 450,878 (HTTP Archive, Core Web Vitals Technology Report, October 2026). 88.9% of Shopify origins have a good LCP and 92.7% a good CLS on mobile (HTTP Archive, Core Web Vitals Technology Report, October 2026). On desktop, 79.9% of Shopify origins pass (HTTP Archive, Core Web Vitals Technology Report, October 2026). WooCommerce is still the bigger platform by count, with 522,207 mobile origins in the same data (HTTP Archive, Core Web Vitals Technology Report, October 2026).
Which Core Web Vital is getting worse?
Responsiveness. The share of Shopify origins with a good INP fell from 88.6% in July 2026 to 85.9% in October (HTTP Archive, Core Web Vitals Technology Report, October 2026). INP measures how fast a page reacts to a tap, and scripts from apps compete for the same main thread.
Are big brands faster?
No, they are slower. In our test of 537 well-known Shopify brands the median mobile PageSpeed score was 38, and 75.2% scored under 50 (Codersy, Shopify Speed Report 2026, October 2026). Only 0.2% scored 90 or more (Codersy, Shopify Speed Report 2026, October 2026). 72.6% had a good INP and 81.4% a good LCP for real mobile visitors (Codersy, Shopify Speed Report 2026, October 2026). 87.4% had a good CLS (Codersy, Shopify Speed Report 2026, October 2026). The median homepage weighed 7.2 MB and made 406 requests on mobile (Codersy, Shopify Speed Report 2026, October 2026). Headless did not help: 35.9% of Hydrogen storefronts passed Core Web Vitals, against 62.6% of stores on Liquid themes (Codersy, Shopify Speed Report 2026, October 2026). You can test your own store with our free Shopify speed test.
How does Shopify compare with the rest of the web?
Better than average. Across the whole web, 48% of mobile origins and 56% of desktop origins had good Core Web Vitals in 2025, and 77% had a good INP on mobile (HTTP Archive, Web Almanac 2025: Performance, January 2026). Shopify's median mobile Lighthouse performance score was 52, behind Wix at 64 (HTTP Archive, Web Almanac 2025: CMS, January 2026). The median Shopify page loads 1,615 KB of JavaScript on mobile, against 638 KB for WordPress (HTTP Archive, Web Almanac 2025: CMS, January 2026). Shopify runs 21.5% of desktop ecommerce sites (HTTP Archive, Web Almanac 2025: Ecommerce, January 2026) and 7.3% of all mobile sites built on a CMS (HTTP Archive, Web Almanac 2025: CMS, January 2026).
What is speed worth?
Measurable money. A 0.1-second faster mobile site raised retail conversions by 8.4% and average order value by 9.2%, and travel conversions by 10.1% (Deloitte, Milliseconds Make Millions, March 2020). On luxury sites, page views per session rose 8.6% (Deloitte, Milliseconds Make Millions, March 2020). Vodafone Italy improved LCP by 31% and made 8% more sales, and Cdiscount improved all three Core Web Vitals, which contributed to a 6% revenue uplift in its Black Friday sale (Google, web.dev case studies, November 2026).
What do apps and third-party scripts cost?
Every app is a script on every page. The stores with the fewest scripts are the fastest, and the difference is large.
How many apps does Shopify have?
Thousands, and developers earn well from them. Shopify has paid more than $1.3 billion to the developers who build on its ecosystem (Shopify, Billion-dollar ecosystem, April 2026).
How much do third-party scripts weigh?
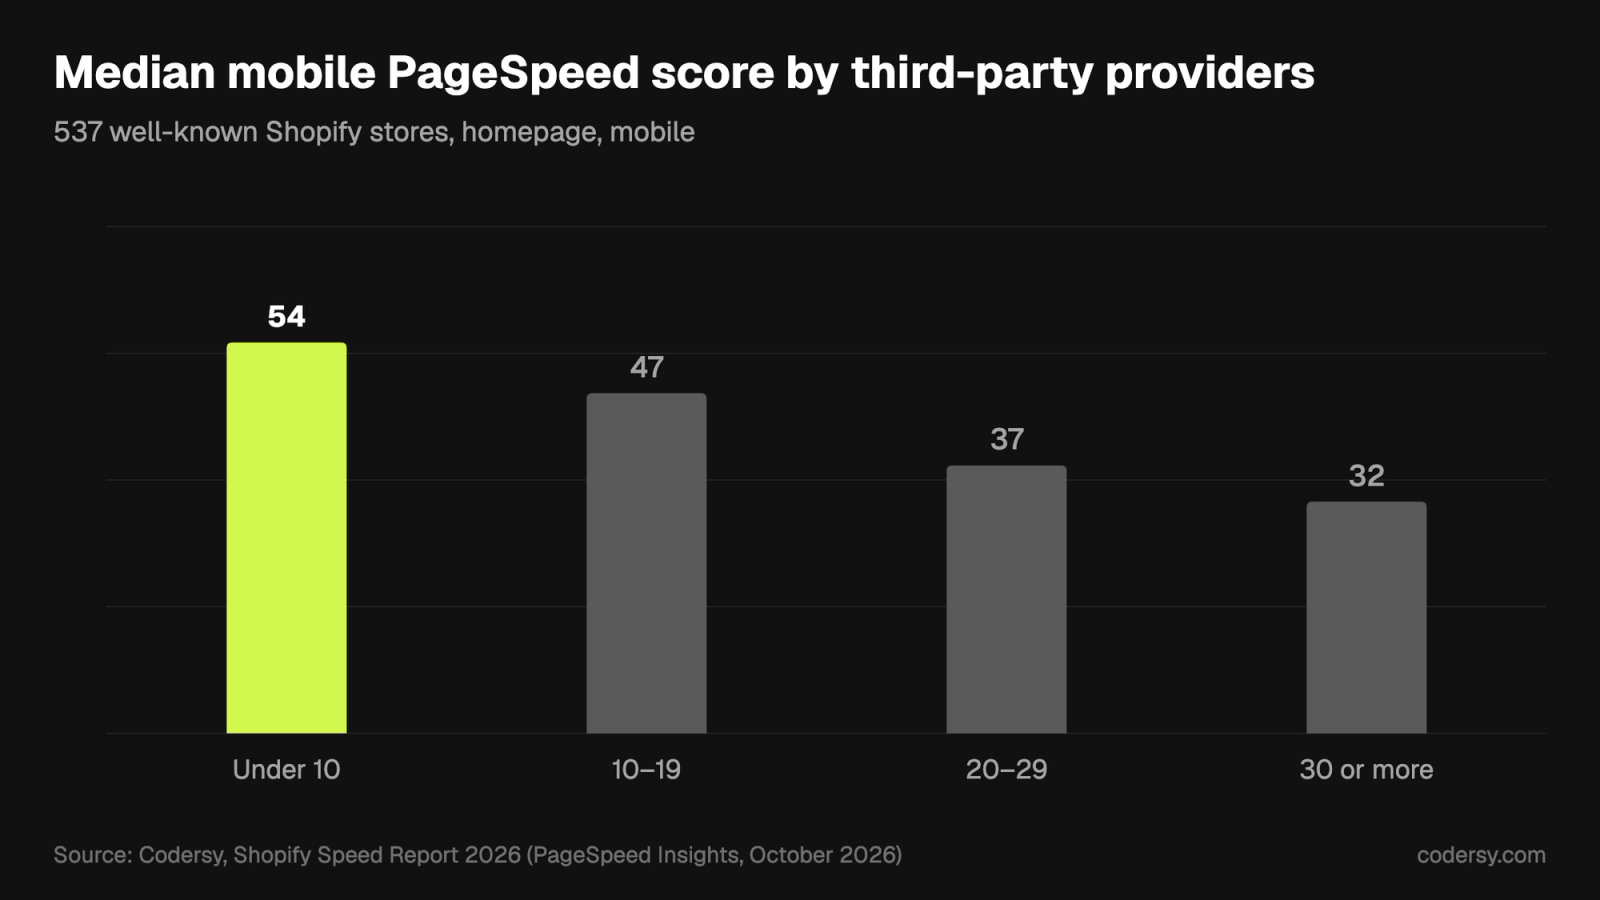
A third of the page. Third-party providers make up 32.3% of the median store's homepage weight and take 1.6 seconds of main-thread work on a phone (Codersy, Shopify Speed Report 2026, October 2026). Klaviyo loads on 78.9% of the stores we tested and Google Tag Manager on 65% (Codersy, Shopify Speed Report 2026, October 2026). Stores with fewer than 10 providers had a median score of 54, against 32 for stores with 30 or more (Codersy, Shopify Speed Report 2026, October 2026), and 71.2% of them passed Core Web Vitals, against 45.4% (Codersy, Shopify Speed Report 2026, October 2026).
How common are third parties on the web?
Almost universal. At least 90% of web pages load one or more third parties, and the median mobile page makes 79 third-party requests (HTTP Archive, Web Almanac 2025: Third Parties, January 2026). On the top 1,000 sites the median is 106 requests on mobile, and scripts are 24.8% of all third-party requests (HTTP Archive, Web Almanac 2025: Third Parties, January 2026).
What does Shopify require of themes?
A performance floor. Themes in the Shopify Theme Store need an average Lighthouse performance score of at least 60 across the home, product and collection pages (Shopify, Theme performance best practices, November 2026). If your store carries more scripts than it needs, a speed and conversion audit usually finds the cheapest wins first.
Checkout, cart abandonment and conversion
Most carts never become orders, and the reasons are mostly fixable. The single biggest one is a surprise at the total.
How many carts are abandoned?
Seven in ten, and the rate barely moves. Baymard's figure is the average of 50 studies published from 2006 to 2025 (Baymard Institute, Cart Abandonment Rate, October 2026). 42% of US shoppers who abandoned a cart said they were just browsing and not ready to buy (Baymard Institute, Cart Abandonment Rate, October 2026).
Why do shoppers abandon a checkout?
Mostly for reasons the store controls. 20% left because delivery was too slow, 19% did not trust the site with their card details, and 18% were asked to create an account (Baymard Institute, Cart Abandonment Rate, October 2026). 17% found the checkout too long or complicated and 17% hit errors or a crash (Baymard Institute, Cart Abandonment Rate, October 2026). 13% left over the returns policy, 12% could not see the total cost up front, 10% had a card declined and 9% did not find enough payment methods (Baymard Institute, Cart Abandonment Rate, October 2026).
How much can a better checkout recover?
A lot, by Baymard's estimate. Baymard models a 35.26% conversion increase for the average large ecommerce site from better checkout design, and $260 billion of recoverable orders across the US and EU; both are Baymard's own estimates (Baymard Institute, Cart Abandonment Rate, October 2026). In Baymard's benchmark, 65% of sites have a checkout that is "mediocre" or worse, only 2% are "good", and the average site has 32 improvements to make (Baymard Institute, Checkout Usability, November 2026).
What does Shopify claim for its checkout?
Better conversion, by its own studies. Shopify says its checkout converts up to 36% better than competitors' and 15% better on average (Shopify, Checkout, April 2023). Shopify says Shop Pay converts up to 50% better than guest checkout (Shopify, Shop Pay, April 2023), outpaces other accelerated checkouts by at least 10%, and lifts lower-funnel conversion by 5% just by being present (Shopify, Shop Pay, April 2023). Shopify also says 43% of buyers already prefer Shop Pay and 1 in 5 choose it at checkout (Shopify, Shop Pay, November 2026), and that Shop Pay Installments cut cart abandonment by 28% on average (Shopify, Checkout, November 2026). All of these are Shopify's claims, mostly from a 2023 study it commissioned. If your checkout loses orders, our conversion work starts there.
AI shopping and agentic commerce
AI is still a small channel, but it is the only one that converts better than search. And it sends shoppers straight to the product.
How fast is AI traffic to stores growing?
Very fast, from a small base. In Q1 2026 AI-referred sessions to Shopify stores grew more than eight times year on year (Shopify, AI search insights, May 2026). In Q2 2026 AI-referred sessions grew 197% and orders three times (Shopify, AI search and category behavior, August 2026). Across US retail, traffic from generative AI tools rose 693.4% in the 2025 holiday season and 670% on Cyber Monday (Adobe, Holiday shopping season 2025, January 2026). For the 2026 season Adobe forecasts AI traffic up 130%, with Thanksgiving up 159% (Adobe, 2026 holiday forecast, September 2026).
Do AI shoppers convert?
Better than search shoppers. AI-referred sessions convert better than organic search in 23 of 25 product categories, and their orders are 14% larger (Shopify, AI search insights, May 2026). In taste-led categories AI brings new customers at about 1.3 times the rate of organic search (Shopify, AI search and category behavior, August 2026). In an Adobe survey, 77% of shoppers who used AI felt more confident in their purchase and 69% were less likely to return the item (Adobe, 2026 holiday forecast, September 2026).
How ready is Shopify for agentic commerce?
The plumbing is in place. Shopify says more than 1 billion products in its catalog can be discovered across AI channels, that more than 400 million shoppers have Shop Pay accounts, and that daily Sidekick sessions grew 4.2 times year on year (Shopify, Editions Fall '26, November 2026). Its Universal Commerce Protocol is backed by more than 20 retailers and platforms (Shopify, AI commerce at scale, January 2026). More in our glossary: agentic commerce and generative engine optimization.
Ecommerce market context
Ecommerce keeps taking share from stores, slowly in the US and unevenly in Europe.
How big is US ecommerce?
$340 billion a quarter. US ecommerce sales were $340.2 billion in Q2 2026, seasonally adjusted, 3.8% more than in Q1 and 12.2% more than a year earlier (US Census Bureau, Quarterly E-Commerce Report, August 2026).
How many Europeans shop online?
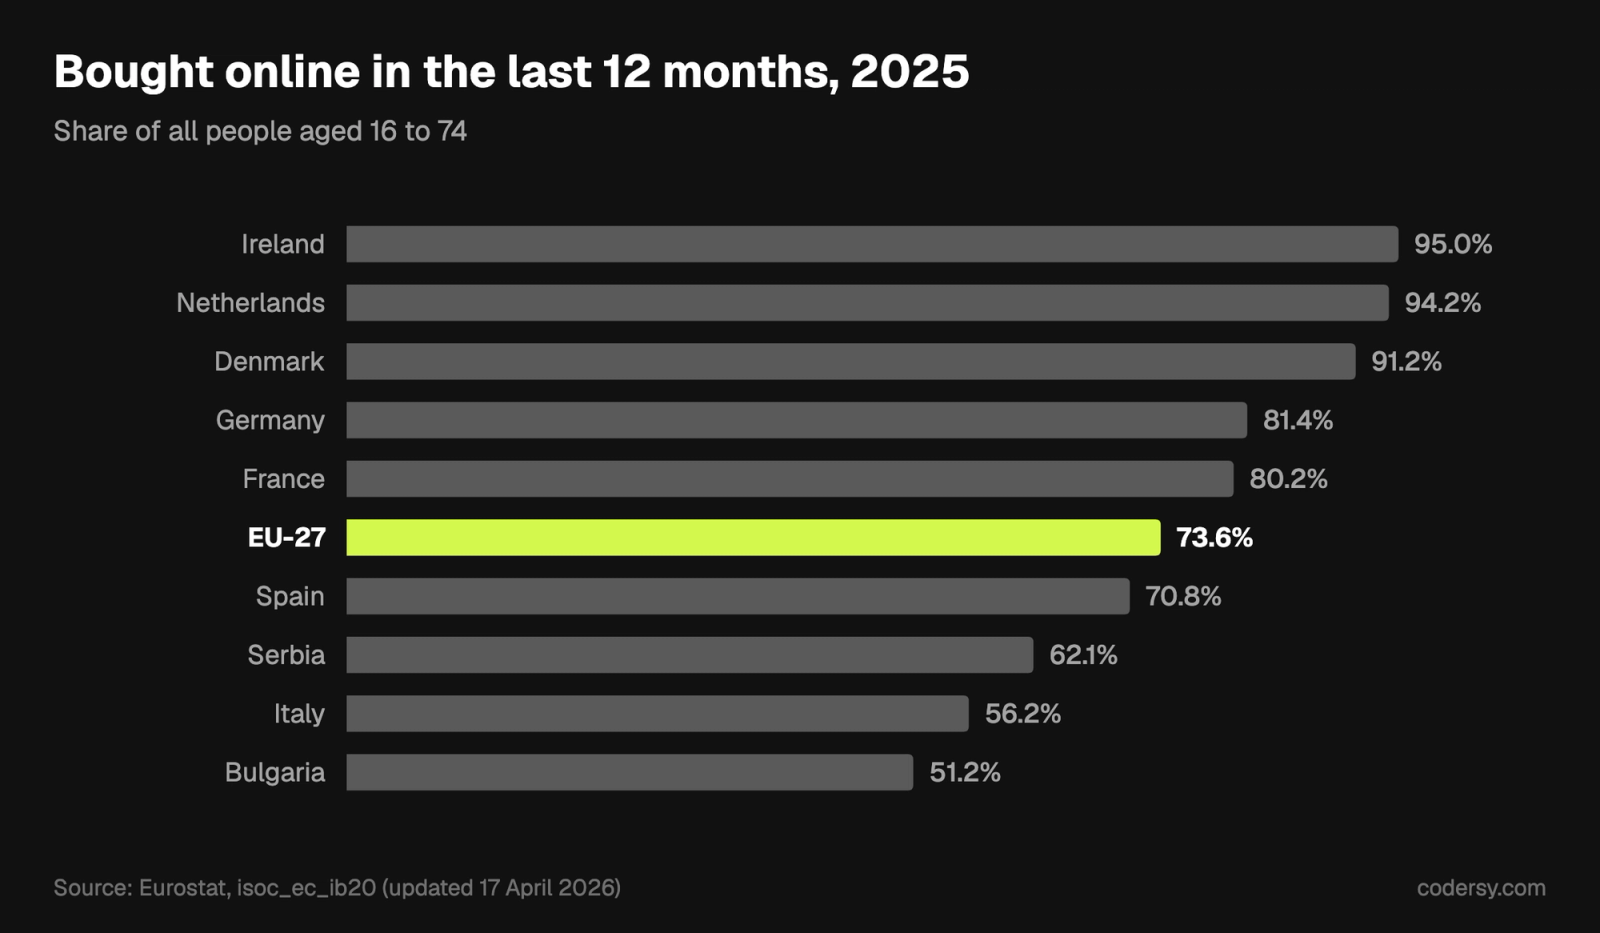
Three in four. 73.6% of all people aged 16 to 74 in the EU bought online in the last 12 months of 2025 (Eurostat, isoc_ec_ib20, April 2026). Counted among internet users only, the share is 78%, up from 62% in 2015 (Eurostat, E-commerce statistics for individuals, February 2026). The share is 95.1% in Ireland, 94.2% in the Netherlands, 81.4% in Germany, 80.2% in France and 56.2% in Italy (Eurostat, isoc_ec_ib20, April 2026). Denmark is at 91.2% and Spain at 70.8% (Eurostat, isoc_ec_ib20, April 2026). For one market in detail, see our ecommerce statistics for Serbia.
What will the 2026 holiday season bring?
Another record, by Adobe's forecast. Adobe expects US online holiday spending of $275.1 billion from 1 November to 31 December 2026, up 6.7%, with $15.1 billion on Cyber Monday (Adobe, 2026 holiday forecast, September 2026). Cyber Week is forecast at $47.5 billion, up 7.4%, and Black Friday at $12.9 billion, up 9.2% (Adobe, 2026 holiday forecast, September 2026). Mobile is forecast at 57.4% of the season's spending and buy now, pay later at $21.3 billion (Adobe, 2026 holiday forecast, September 2026). The 2025 season actually reached $257.8 billion, up 6.8%, with $20 billion spent through buy now, pay later (Adobe, Holiday shopping season 2025, January 2026). Cyber Week brought in $44.2 billion and Cyber Monday $14.25 billion (Adobe, Holiday shopping season 2025, January 2026), and 56.4% of online transactions were made on a smartphone (Adobe, Holiday shopping season 2025, January 2026).
What does Shopify cost?
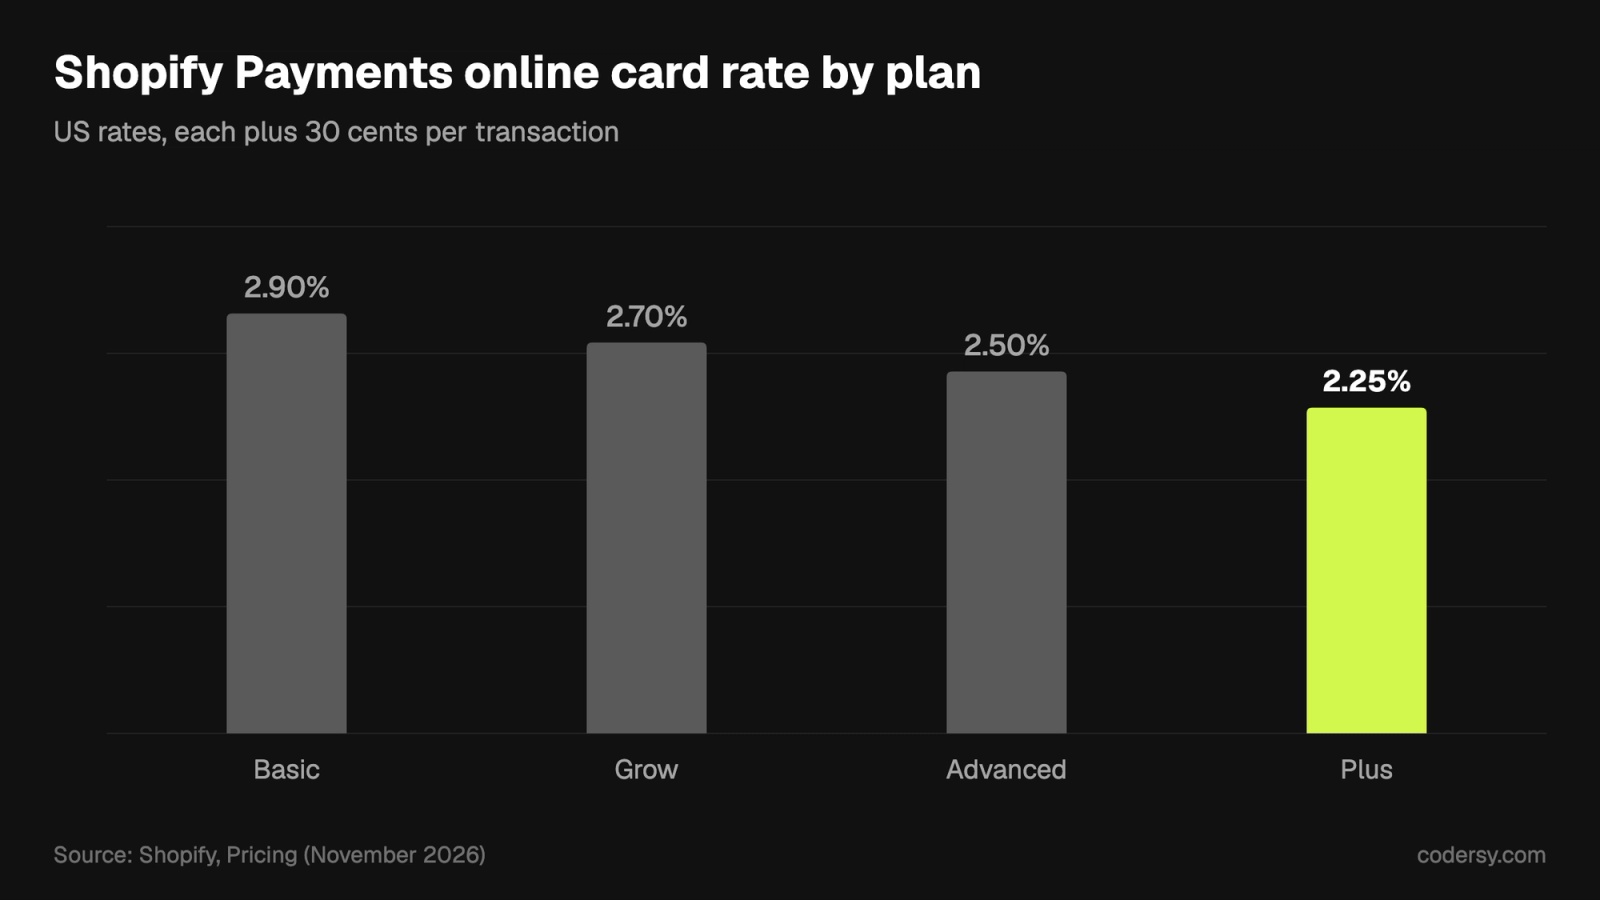
Shopify's plans are cheap; the payment fees are where the money goes. The fee gap between plans is what makes an upgrade pay for itself.
How much are Shopify's plans?
From $29 to $2,300 a month. In the US, Basic costs $29 a month paid yearly or $39 monthly, Grow $79 or $105, and Advanced $299 or $399 (Shopify, Pricing, November 2026). Shopify Plus starts at $2,300 a month (Shopify, Pricing, November 2026).
What are the payment fees?
They fall as the plan rises. In-person card rates are 2.6%, 2.5%, 2.4% and 2.3% plus 10 cents on Basic, Grow, Advanced and Plus (Shopify, Pricing, November 2026). Using a third-party payment provider instead of Shopify Payments adds 2%, 1%, 0.6% or 0.2% per transaction (Shopify, Pricing, November 2026). Shopify Payments is not available in every country, Serbia among them (Shopify Help Center, Supported countries and regions for Shopify Payments, November 2026); merchants there pay this fee on every online card payment taken through another provider. More in our glossary: Shopify Payments.
What does Plus cost on top?
More than the headline price. On Plus, premium cards cost 2.95% plus 30 cents, international cards add 1%, POS Pro is $89 a month per location, and contracts run for one or three years (Shopify, Shopify Plus pricing, November 2026). Our Shopify fee calculator shows at what revenue an upgrade pays off, and the glossary explains total cost of ownership.
Methodology and Sources
We use only data from the organisation that produced it and link the original filing, report or dataset, never a statistics roundup. Shopify's financial figures come from its SEC filings and investor releases. Platform speed figures come from HTTP Archive, which reads the Chrome UX Report; our own Speed Report tests a hand-picked sample of 537 well-known brands, so its numbers describe big brands, not the average store. Figures that are a company's own claim or model are labelled as such. Prices are US prices. We update the page every month, and after every Shopify quarterly result.
Sources
- Shopify Inc., Form 10-Q for the quarter ended September 30, 2026
- Shopify Inc., Form 10-K for 2025
- Shopify Inc., Form 10-K for 2024
- Shopify, Q3 2026 results press release
- Shopify, Q4 2025 results
- Shopify, Investor Relations
- HTTP Archive, Core Web Vitals Technology Report
- HTTP Archive, Web Almanac 2025: Ecommerce
- HTTP Archive, Web Almanac 2025: Performance
- HTTP Archive, Web Almanac 2025: CMS
- HTTP Archive, Web Almanac 2025: Third Parties
- Codersy, Shopify Speed Report 2026
- Deloitte, Milliseconds Make Millions
- Google, web.dev: Core Web Vitals business impact
- Shopify, Billion-dollar ecosystem
- Shopify, Theme performance best practices
- Baymard Institute, Cart Abandonment Rate
- Baymard Institute, Checkout Usability
- Shopify, Checkout
- Shopify, Shop Pay
- Shopify, AI search insights
- Shopify, AI search and category behavior
- Shopify, Editions Fall '26
- Shopify, AI commerce at scale
- Adobe, Holiday shopping season 2025 results
- Adobe, 2026 US holiday shopping forecast
- US Census Bureau, Quarterly E-Commerce Report
- Eurostat, Internet purchases by individuals (isoc_ec_ib20)
- Eurostat, E-commerce statistics for individuals
- Shopify, Pricing
- Shopify Help Center, Supported countries and regions for Shopify Payments
- Shopify, Shopify Plus pricing
Glossary
- GMV: gross merchandise volume, the total value of orders sold through a platform.
- MRR: monthly recurring revenue, Shopify's subscription revenue at a point in time.
- Penetration: the share of GMV processed through Shopify Payments.
- Core Web Vitals (CWV): Google's three measures of real-user experience: LCP (loading), INP (responsiveness) and CLS (visual stability).
- CrUX: the Chrome UX Report, Google's dataset of real Chrome users' experience, which HTTP Archive reads.
- Origin: one website, as counted in the Chrome data.
- Third party: a script, font or service loaded from another company's server, such as an app, tag or chat widget.
- AOV: average order value.
- BNPL: buy now, pay later.
- Agentic commerce: shopping in which an AI assistant finds, compares or buys products for the shopper.
- UCP: the Universal Commerce Protocol, Shopify's standard for selling through AI agents.
Scaling on Shopify Plus?
Migration, B2B, architecture, performance — we run the engagements other agencies hand back.
The checklist we run before touching a client's code
Get it by email, plus a few short notes over the next two weeks: what we see most often on Shopify stores and what actually fixes it.
Want more of our posts in your Google results? Add Codersy as a preferred source.
Add Codersy on Google(opens in a new tab)